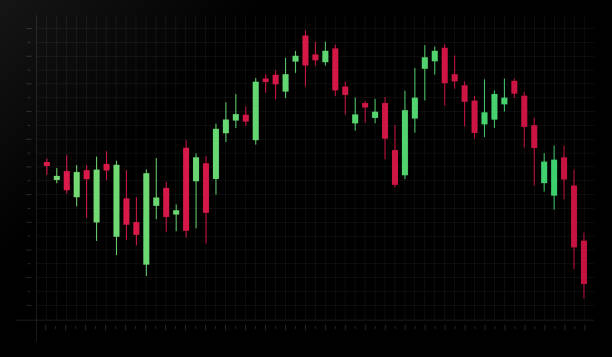
Chart patterns are important for anyone starting in stock trading. These patterns help forecast future price movements based on historical data. By recognising these formations, you can decide on profitable trade and manage risks.
Best Chart Patterns for Beginners
If you are a beginner, you can try the following chart patterns for a successful trade. You can also enrol on a stock market technical analysis course online to get an in-depth understanding.
Double Bottom
The double bottom is a bullish reversal chart pattern. It signals a possible change in trend from down to up. A double bottom pattern is formed after a prolonged downtrend when the price hits a support level, rebounds, and then retests the same support to create two distinct “bottoms” that look like a “W” on the chart. Before you take a long position, wait for the price to break over the neckline, which is the resistance level formed by the peak between the two bottoms.
For example, suppose a stock fell from ₹200 to ₹150 and found strong support at ₹150, and then rose to ₹170 before falling again to ₹150. The two lows at ₹150 form the double bottom, and the peak at ₹170 acts as the neckline.
Once the price goes above ₹170 with good volume, it indicates a reversal, and you may expect the stock to rise further, often by a height equal to the distance between the bottoms and the neckline. In this case, that could mean a potential rise of ₹20 (from ₹150 to ₹170), targeting around ₹190.
Cup and Handle
The cup and handle identifies possible bullish trends. It looks like a teacup: the “cup” forms after a stock experiences a decline followed by a rise to create a U-shape. The “handle” is a short consolidation or pullback after the cup, usually sloping slightly downward. This pattern indicates that the stock is building momentum for a breakout.
For example, suppose a stock that was once trading at ₹500 begins to fall over a few months to ₹450 and forms the left side of the cup. Gradually, it recovers to ₹500 over the next few months, completing the cup.
Then, the stock slightly dips to ₹480, forming the handle. When it finally breaks above ₹500 on higher volume, this breakout confirms the pattern, suggesting a potential upward move. You can place buy orders just above the breakout point and use the depth of the cup to estimate the price target.
Head and Shoulders
The head and shoulders signal that an upward trend may end soon, and a downward trend could begin. The pattern consists of three peaks: the first and third are smaller shoulders, while the middle peak is the head, the highest point. A neckline connects the lows between these peaks. When the price goes below the neckline after forming the right shoulder, it suggests a sell signal.
For example, a stock in an uptrend soars to ₹100 (left shoulder), then pulls back to ₹90. It then rises to ₹110 (head) before dropping back to ₹90 again. Finally, it rises to ₹105 (right shoulder) and falls once more. Drawing a line connecting the two lows at ₹90 forms the neckline.
If the stock price breaks below ₹90 with strong volume, it signals that the bullish trend is over, and a bearish trend may follow. You can measure the distance from the head to the neckline and project it downward from the point of breakout to estimate a target price.
Conclusion
To effectively use these chart patterns, start by observing them on your preferred stocks and wait for clear breakouts or confirmations before taking positions. Combine this with proper risk management and position sizing.
Practising with small trades or paper trading will build your confidence and help you recognise patterns more accurately for smarter trading decisions in the future. To learn more, enrol in a technical analysis course online from Upsurge.club.


